Trading volume in cryptocurrency measures the total amount of an asset traded within a set period and serves as a key indicator of market activity, liquidity, and trader conviction. By analyzing trading volume alongside price movements, traders can better gauge the strength and reliability of trends, identify potential reversals, and spot signs of manipulation or unusual market behavior. While trading volume is a valuable tool, it should be interpreted in context with other factors for well-informed trading decisions.
Trading volume is one of the most telling numbers in crypto, yet it is easy to scroll past without really understanding what it is saying. At its core, trading volume is the total amount of a cryptocurrency bought and sold over a given period, usually tracked in 24-hour windows. It shows how active the market is, how much interest the asset attracts, and whether traders back a price move with absolute conviction or just noise. Whether you are just getting started or have been trading for years, understanding volume can sharpen your market read and help you make more grounded decisions.
What Is Trading Volume?
Trading volume measures the total flow of money moving into and out of a cryptocurrency market over a set period. This includes all trades on both centralized exchanges (such as Coinbase or Binance) and decentralized exchanges (DEXs such as Uniswap). Volume is typically quoted in USD, though some platforms also report it in BTC or other base currencies.
Think of volume as the heartbeat of a market. A steady, strong pulse indicates that traders actively trade the asset and that broad participation supports it. A weak or erratic pulse can signal trouble, or at a minimum, uncertainty.
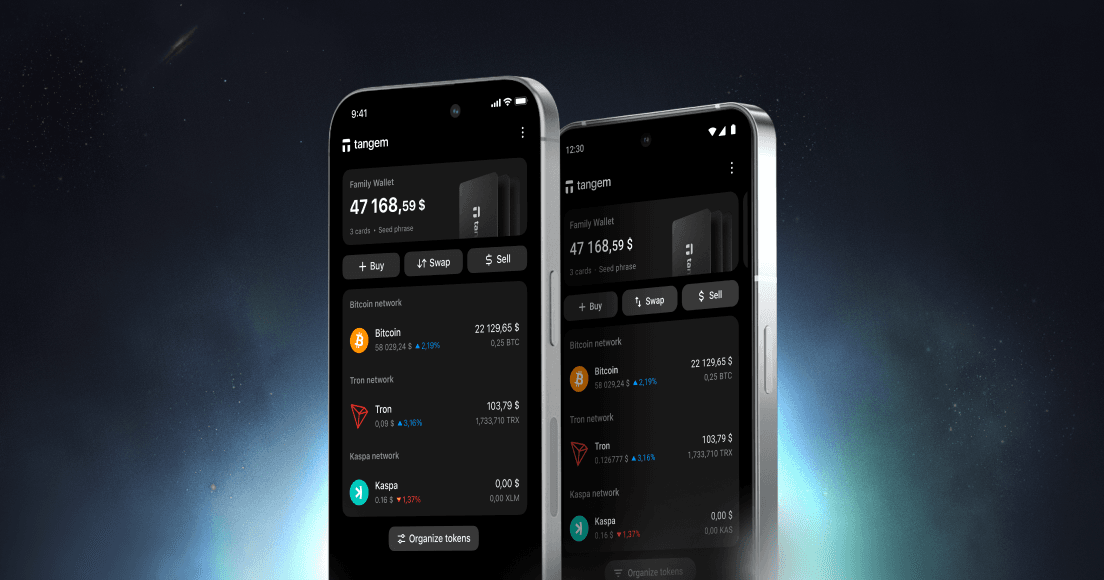
In practice, in the Market section of a crypto app like Tangem, the 24-hour volume figure shows the total dollar value of that token traded over the past day. A token with $500M in daily volume behaves very differently from one with $50,000 in daily volume.
Why Trading Volume Matters
Volume does not operate in isolation. Its real value comes from reading it alongside the price. Here is what it tells you:
Liquidity: High volume means you can buy or sell quickly without your order moving the price much. Low-volume markets are more complex to enter and exit cleanly, and large trades can cause outsized price swings, a problem known as slippage.
Market Sentiment: Volume reflects the level of interest and conviction behind a price move. A sharp price rally accompanied by surging volume tends to signal genuine demand. The same rally on thin volume is more challenging to trust.
Trend Confirmation: Volume helps separate durable trends from short-lived ones. A breakout on substantial volume carries more weight than one that slips through on minimal activity.
Early Volatility Warning: A sudden spike in volume, even before a major price move, often signals that something significant is about to happen. Traders watch for unusual volume as an early indicator of incoming turbulence.
Entry and Exit Signals: Many traders use volume to time their moves. A breakout on high volume is often a green light to enter. A breakout with minimal volume is often a red flag, what traders call a false breakout.
How to Read Volume Alongside Price
The real skill is interpreting volume in context. Here is a simple framework most traders use:
Price
Volume
What It Suggests
Rising
Rising
Strong uptrend with real buyer interest
Rising
Falling
Weak move, possible reversal ahead
Falling
Rising
Strong downtrend with real selling pressure
Falling
Falling
Trend losing momentum, possible reversal
Price moves mean more when volume backs them up.
Trading Volume vs. Liquidity
These two concepts are often confused, but they are not the same thing. Volume is what has already traded. Liquidity is what allows one to trade right now without significantly moving the price. A high-volume asset is usually highly liquid because many buyers and sellers are active and ready to transact. But this is not always guaranteed, especially in crypto, where conditions can shift fast.
One practical consequence of low-volume, low-liquidity markets is the creation of arbitrage opportunities. If traders trade a token thinly on a smaller exchange, the market can temporarily misprice it relative to larger platforms. Traders who spot these gaps can buy low on one exchange and sell higher on another. These windows close quickly, but they exist precisely because volume is uneven across the market.
How Trading Volume Affects Crypto Prices
More volume does not automatically mean prices go up. It means more participants are active, which can push prices in either direction:
Bullish volume: When prices rise, and volume rises together, that is usually genuine demand. More buyers than sellers, more money entering the market.
Bearish volume: When prices fall, and volume is high, that signals real selling pressure. People are exiting, not just trimming positions.
Manipulation and wash trading: High volume can sometimes be misleading. Some exchanges and projects have historically inflated volume through wash trading, in which the same entity repeatedly buys and sells to create the appearance of activity. Cross-referencing volume across multiple reputable sources helps here.
Volume divergence: One of the more useful signals is when price and volume move in opposite directions. If price keeps rising while volume steadily declines, it often signals that the rally is running out of gas.
What Counts as High or Low Volume?
This question does not have a fixed answer because high and low are always relative to the asset. Bitcoin trading $20 billion in a day is normal. A small-cap altcoin doing the same would be extraordinary and warrant close investigation. The most helpful approach is to compare an asset's current volume to its own historical average. Most charting tools display volume as bars beneath the price chart, making it easy to spot when today's activity is unusual.
A general rule of thumb: if volume is two to three times higher than the recent daily average, something meaningful is likely happening. That could be news, a product launch, a whale moving large amounts, or a coordinated pump.
Volume Indicators Used by Traders
Beyond raw volume numbers, traders use several volume-based indicators to sharpen their analysis:
On-Balance Volume (OBV): Adds volume on up days and subtracts it on down days, creating a running total. When OBV rises with price, it confirms the trend. When they diverge, it may signal an upcoming reversal.
Volume Weighted Average Price (VWAP): The average price of an asset weighted by volume throughout the day and widely used by institutional traders as a benchmark. A price above VWAP is generally bullish intraday; below it is bearish.
Volume Profile: Shows how much trading occurred at specific price levels over a period. High-volume price levels tend to act as strong support or resistance, since many traders initially entered at those levels.
Chaikin Money Flow (CMF): Measures buying and selling pressure based on both price and volume. Positive values indicate buying pressure; negative values indicate selling pressure.
Practical Limitations of Volume Data
Volume is a valuable signal, but it is not foolproof. A few things worth keeping in mind:
Not all exchanges report volume honestly. Regulators and investigators have caught some smaller platforms inflating their numbers.
Spot volume and derivatives volume are different things. A large futures market can show massive volume even when little actual spot trading occurs.
Volume alone does not tell you direction. It only tells you intensity. Combine it with price action and broader context.
Thin markets can yield erratic volume figures, resulting in lower volumes than in a deep, liquid market.
Frequently Asked Questions
Does high trading volume always mean a cryptocurrency is a good investment?
Not necessarily. High volume shows that traders are actively trading the asset, but it says nothing about where prices will head or about the project’s fundamentals. High volume during a crash can actually accelerate losses. Always consider volume alongside price direction, news, and your own research.
What does it mean when a coin has high price gains but very low volume?
It often means the move is fragile. A price increase on thin volume suggests only a small number of participants drove it, and those moves can reverse quickly once that buying pressure dries up. Traders call this a low-conviction breakout.
Why does trading volume sometimes spike with no obvious news?
A few things can cause this: large institutional players quietly accumulating or distributing, insider activity ahead of an announcement, algorithmic trading patterns, or participants reacting to key technical price levels. Sometimes the reason only becomes clear in hindsight.
Is 24-hour volume the best timeframe to look at?
It depends on what you are trying to understand. The 24-hour figure provides a quick snapshot of current market activity. For longer-term analysis, weekly or monthly volume trends give you a better sense of whether genuine interest in an asset is growing or slowly fading.
How does trading volume differ between centralized and decentralized exchanges?
Centralized exchanges typically show higher volume because they have larger user bases and more liquidity. Decentralized exchanges tend to have lower but often more transparent volume, since on-chain transactions are publicly verifiable on the blockchain. Some traders prefer DEX volume data precisely because it is harder to fake.
Can I use trading volume to predict price movements?
Volume is one helpful input among several, not a crystal ball. It can help you assess whether a trend is likely to continue or reverse, but no single indicator reliably predicts price. Most experienced traders use volume in combination with price action, support and resistance levels, and broader market context.
What is wash trading, and should I worry about it?
Wash trading is when someone buys and sells the same asset repeatedly to create artificial volume, making a coin appear more active than it really is. It is more common on smaller, less regulated exchanges. The best defense is to check volume across multiple reputable sources and be skeptical of coins showing unusually high volume relative to their market cap.
How does trading volume relate to market manipulation?
Volume is one of the clearest fingerprints manipulation leaves behind. A sudden, unexplained volume spike, followed by a sharp price rise and a rapid reversal, is a classic pump-and-dump pattern. Coordinated groups buy to drive up activity and price, attract outside buyers, then sell at the peak. Recognizing these patterns can help you avoid getting caught on the wrong side.
Final Thoughts
Trading volume is one of the most honest signals the market gives you. It does not lie about the level of interest in an asset at any given moment. What it cannot tell you, on its own, is what to do next. That requires combining volume with price, timing, context, and your own goals.
The traders who use volume well are not just looking at the number in isolation. They are asking: Does real participation back this move? Is the market confirming what the chart appears to be showing? Is something unusual happening that warrants a closer look? Get comfortable reading volume, and you will develop a much better instinct for when a market move is the real thing and when it is just noise.
Limited-Time Offer
20% OFF + up to $20 in BTC 🛍️
Selected Wallets
Ends March 16