Switch to seedless. 30% off with SWITCH30 until 26 Oct
For You: See Your Assets, Market Indicators, and Portfolio Insights
This article is available in the following languages:
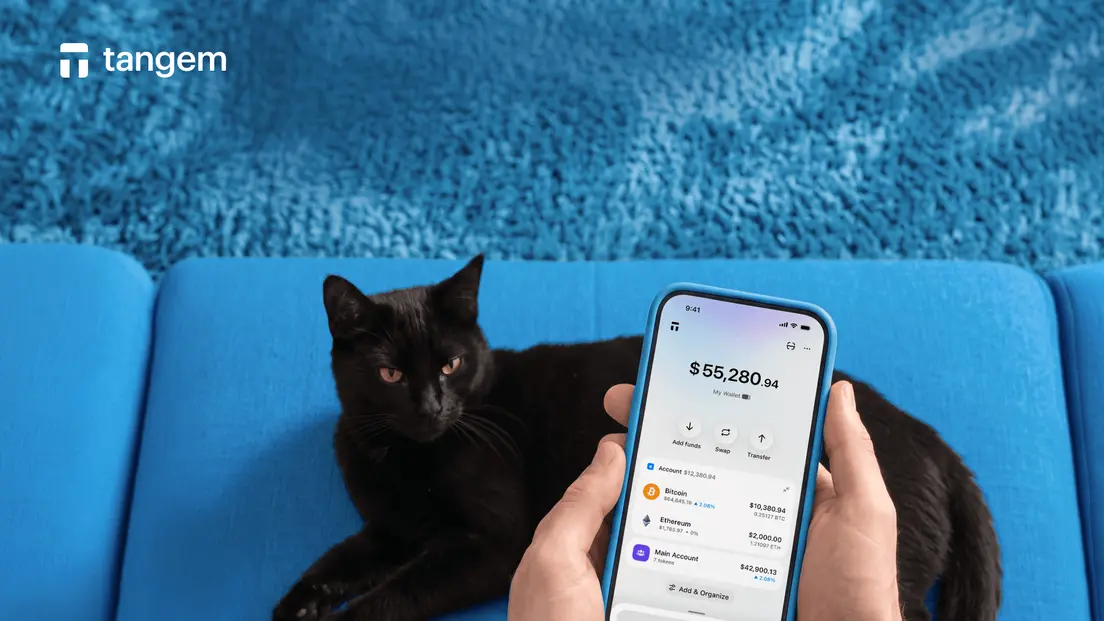
Most people who hold crypto across multiple wallets and networks face the same problem. They do not know, at a glance, what they actually own. Checking means opening one wallet, then another, then a block explorer, then a spreadsheet. The total is always approximate. The picture is always incomplete. For You solves this. One section, three views, one place to see your full financial picture inside Tangem.
This content is for general information and education only and does not constitute investment advice, a financial promotion, or a recommendation to buy, sell, hold, or otherwise deal in any cryptoasset or to use any specific third‑party service. Cryptoassets are high‑risk, can be very volatile, and you could lose all the money you invest. You will not have access to UK compensation or ombudsman schemes in relation to cryptoassets. If you are unsure whether any activity is suitable for you, you should seek independent financial advice. Take 2 mins to learn more.
Portfolio view: your holdings in one number
The portfolio view aggregates all assets across all wallets, accounts, and networks you manage in Tangem. The result is a single, accurate total.
Cross-chain aggregation is the key detail. If you hold USDT on Ethereum, Polygon, and TRON, the portfolio view shows one combined USDT balance. Not three lines on three different screens. One number. This works for every token across every supported network.
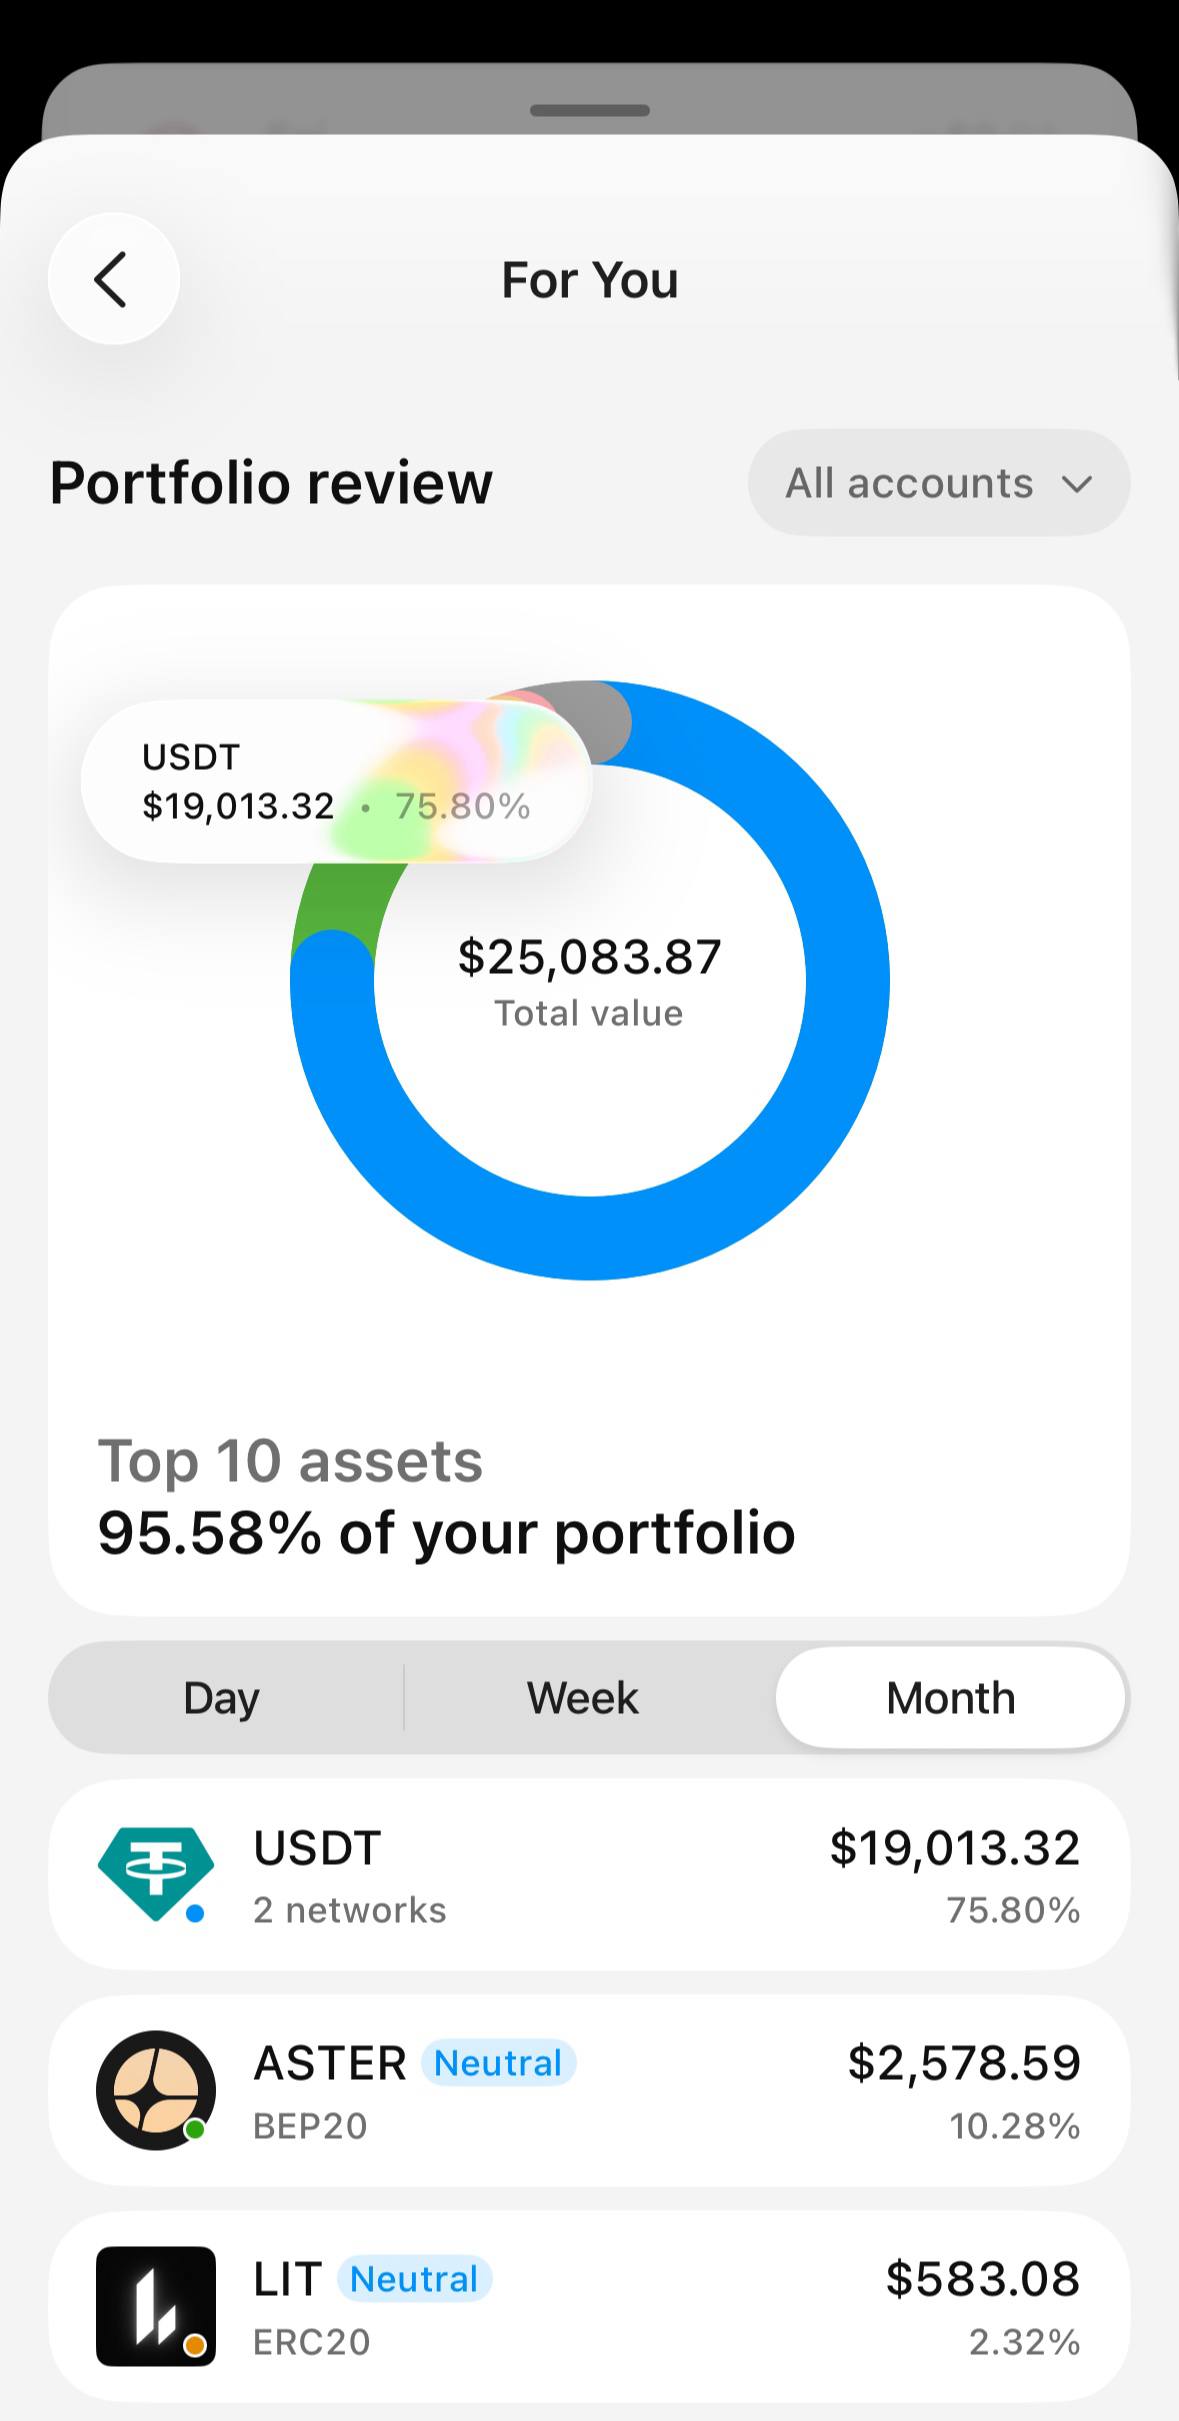
The view displays your top 10 assets ranked by their share of your total portfolio. A breakdown chart visually shows the composition, so you can see at a glance how concentrated or diversified your holdings are.
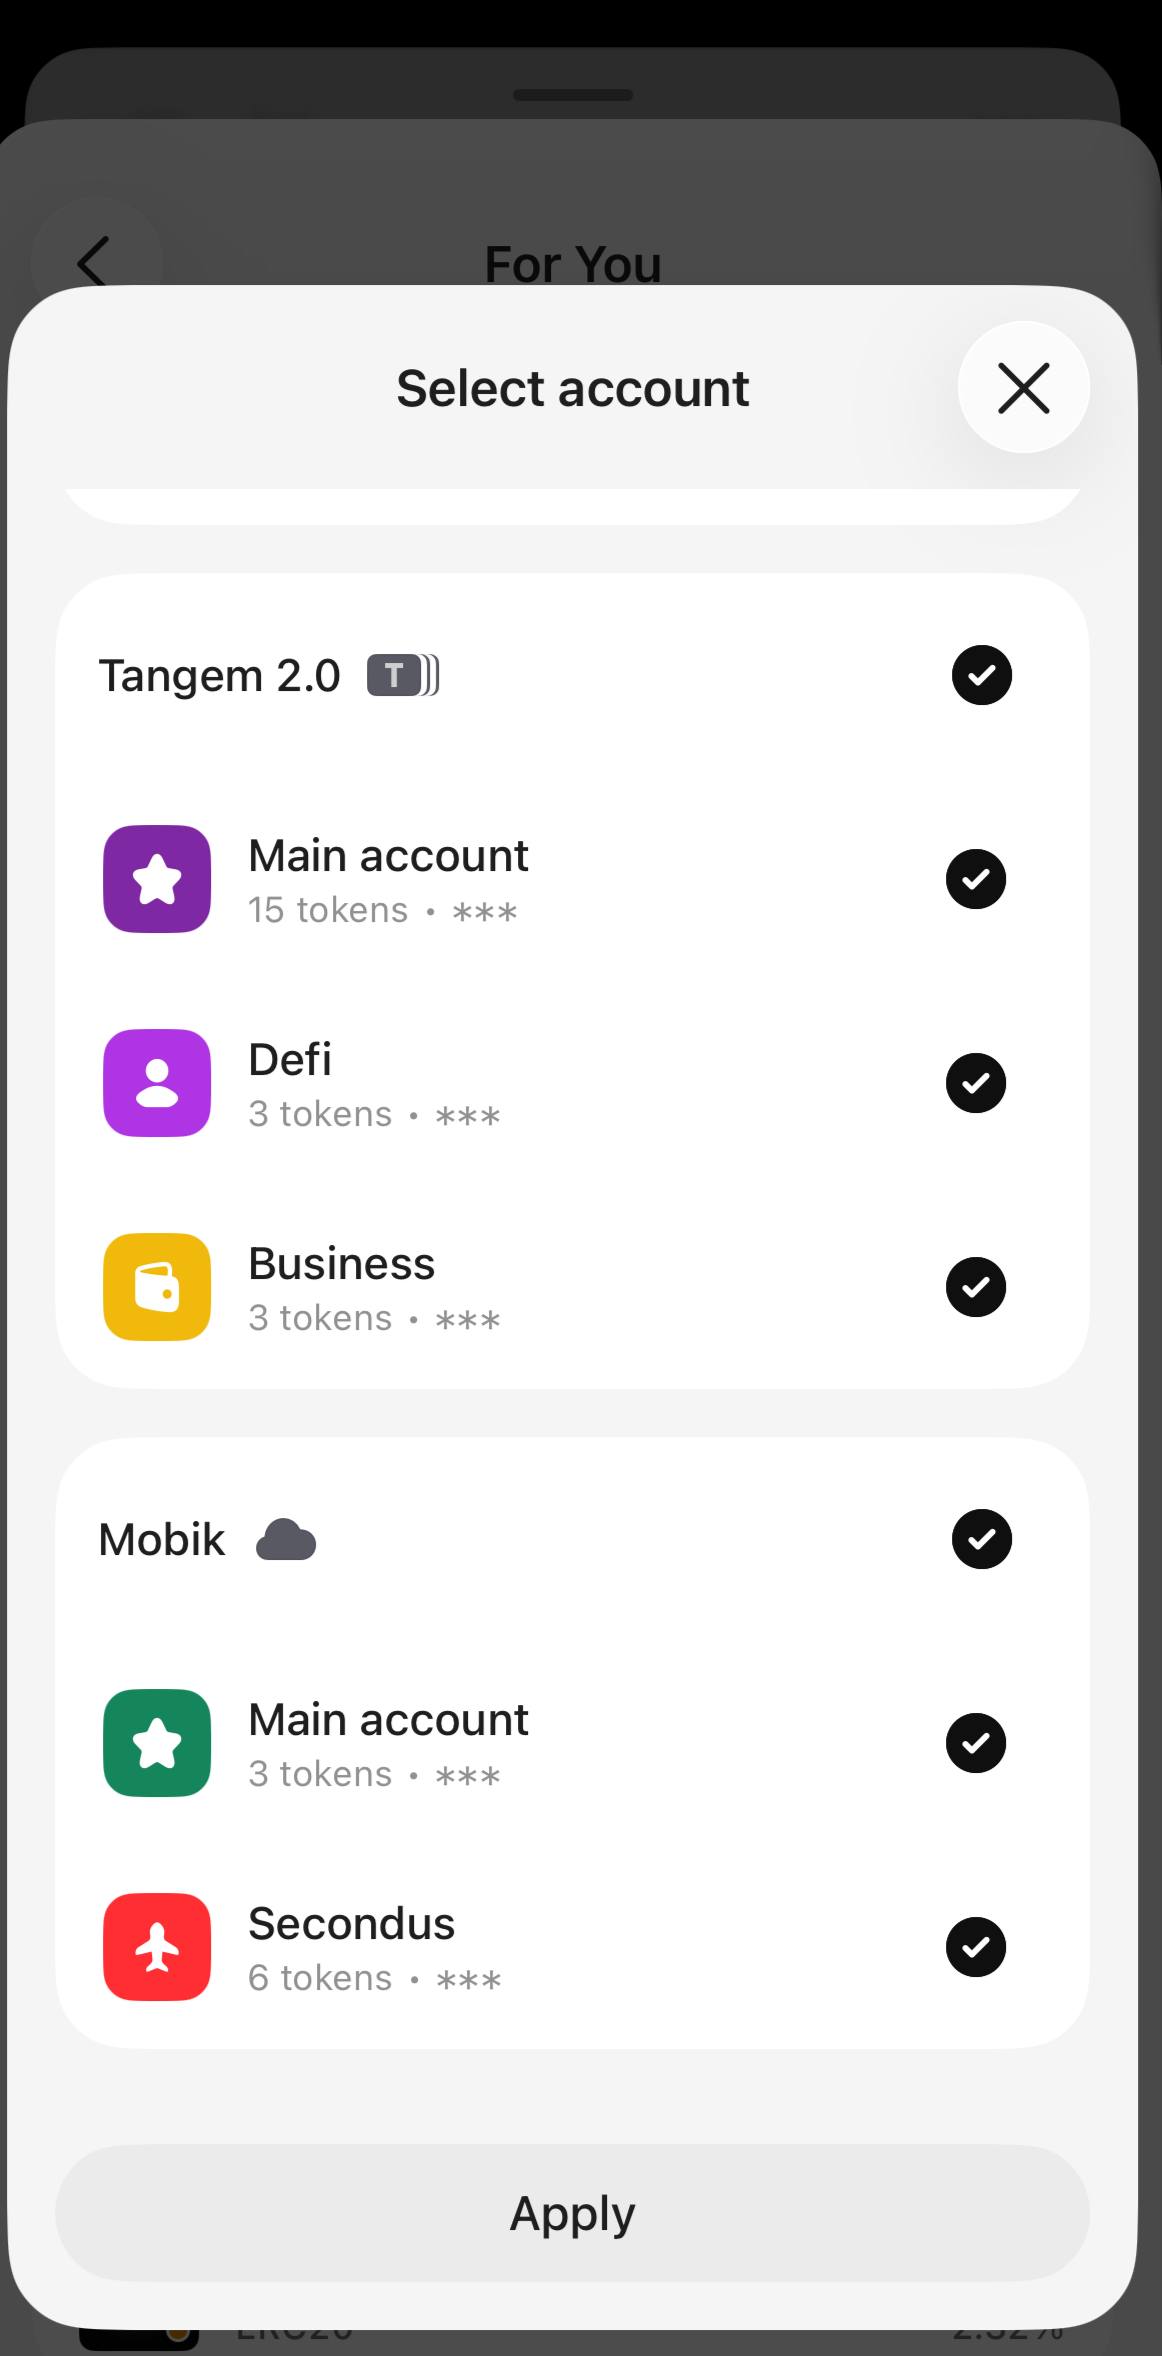
You can filter by a specific wallet to see only that wallet's holdings, rather than the aggregated total. Switch between "All accounts" and individual wallets with a single tap.
The total value displays in your chosen currency. If you have set your app currency to EUR, the portfolio shows in EUR. The composition percentages and market indicators are evaluated against stablecoin base pairs (USDT, USDC).
This is a composition view. It shows what you own and how it is distributed right now. A full profit-and-loss feature is in development for a future release. Do not position the portfolio view as an investment performance tracker.
Market indicator: data at a glance
Each token in your portfolio now shows market indicators. These combine five into one readable panel.
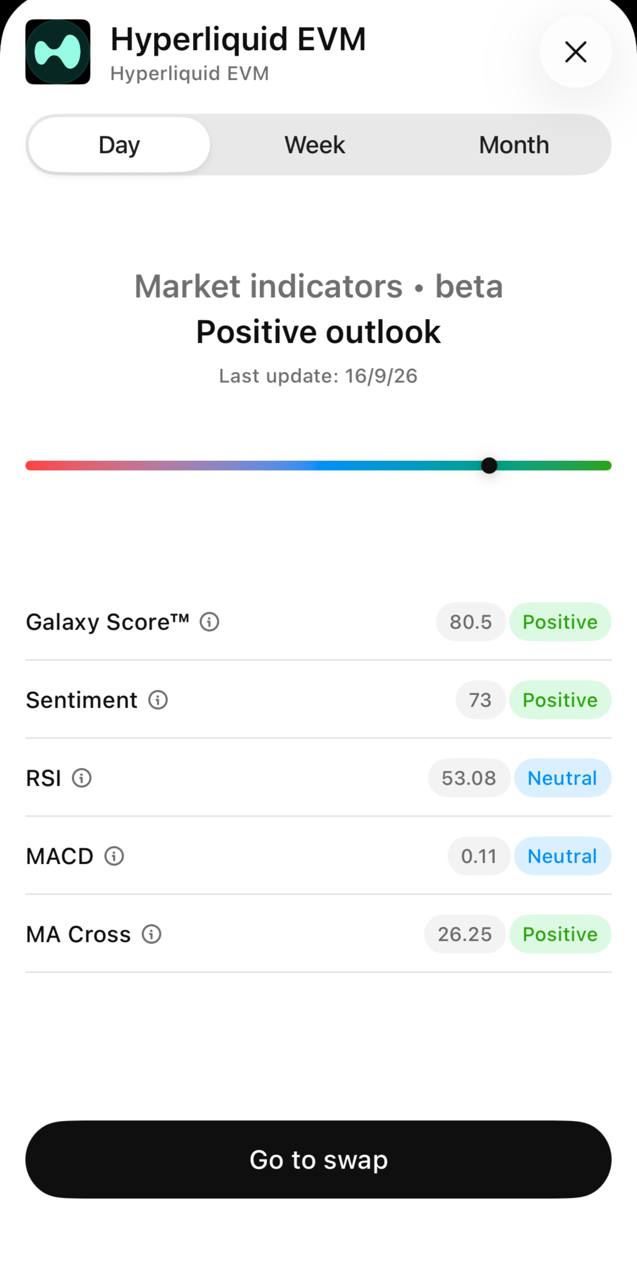
- LunarCrush Galaxy Score. A composite score that measures overall interest and activity around a token, drawn from social media and on-chain data.
Social Sentiment. A measure of whether public conversation about a token leans positive or negative, sourced from LunarCrush's social data aggregation.
- RSI (Relative Strength Index). A technical indicator that measures whether a token has been bought or sold heavily over the last 14 periods. It flags when a token may be overbought or oversold.
- MACD (Moving Average Convergence Divergence). A momentum indicator that tracks the relationship between two moving averages of a token's price. It helps identify potential trend changes.
- Moving Average Cross. A signal based on when a short-term moving average crosses above or below a long-term moving average. A common signal for trend direction.
Each indicator shows a numeric value and a label: positive, neutral, or negative. The combined view gives you a quick read on market conditions without opening five different websites.
You can toggle between three timeframes: daily, weekly, and monthly. Market data also appears on individual token pages in the markets screen, so you can check market indicators while browsing tokens outside of your portfolio.
Important: Market indicators are derived from third-party platforms and based on publicly available data. This is not financial advice. Tangem does not make recommendations. A positive or negative label does not mean you should buy or sell. Always do your own research before making any decisions.
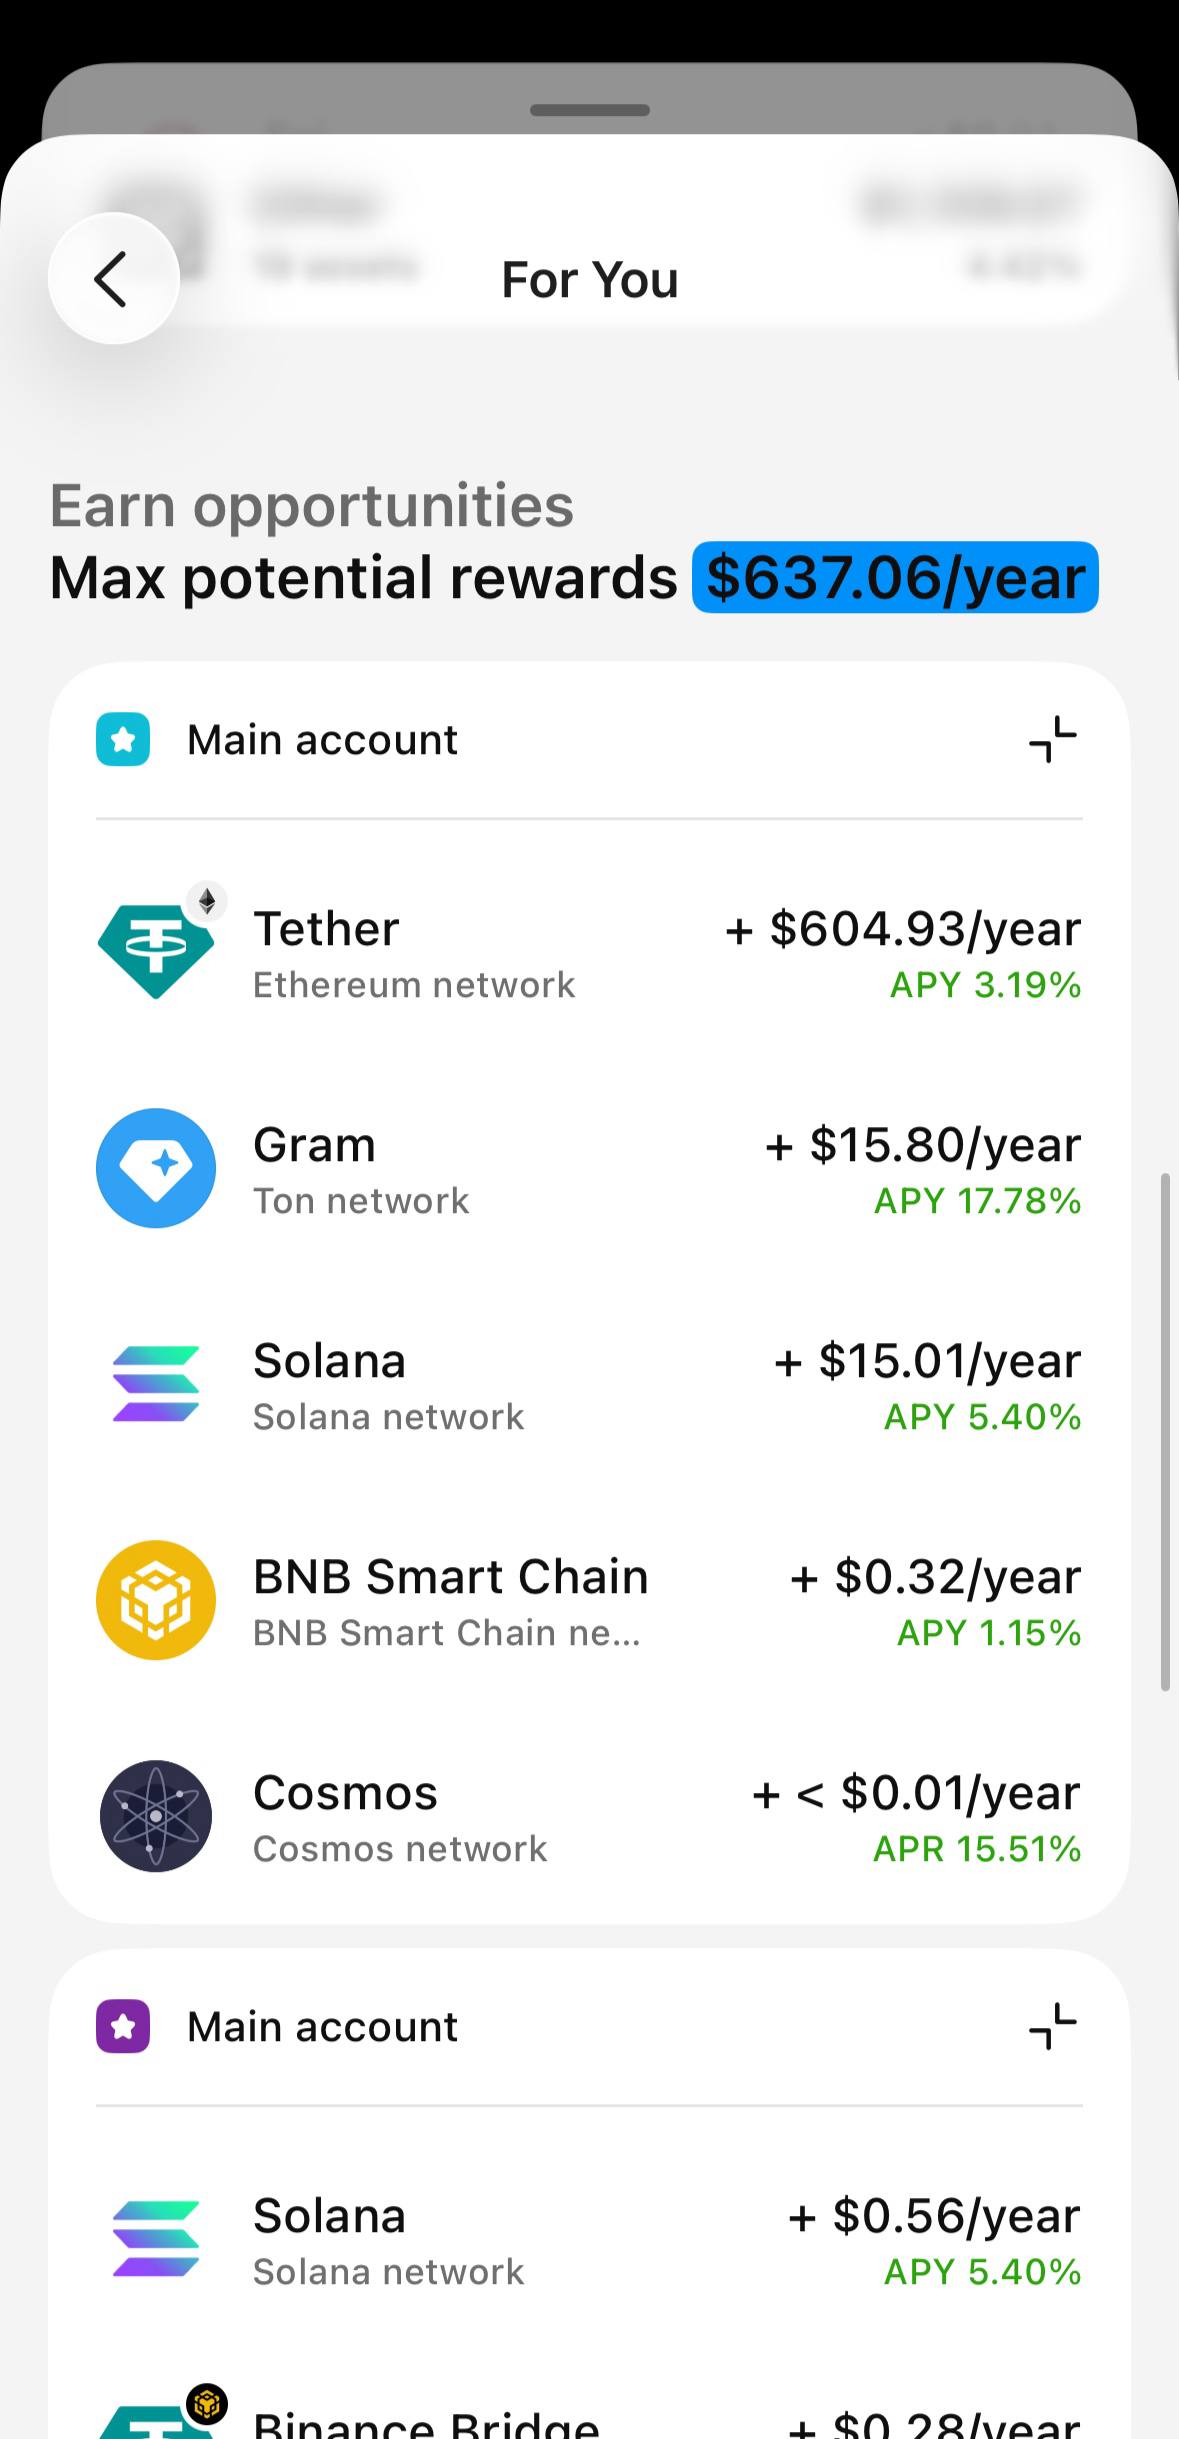
The widget shows an estimated annual return for those idle assets based on current market rates. The calculation is specific to your holdings. Here is how it works.
The app scans your wallets for tokens that support Yield Mode or staking. It checks how much of each token is already allocated. It calculates the estimated annual return only on the portion that is not yet active.
Example. You hold SOL across two accounts. You have staked 30% of your total SOL. The widget calculates the estimated return on the remaining 70% only. It does not count what is already staked.
The top-level display shows a total estimated annual return across all eligible tokens. You can drill into individual tokens to see the APY and estimated dollar amount for each one. From there, you can tap through to activate Yield Mode or staking directly.
The estimates are based on current market rates at the time you view the page. Rates change. This is not a promise, a projection, or a guarantee of future returns. Actual returns may be higher or lower.
How to use the For You page
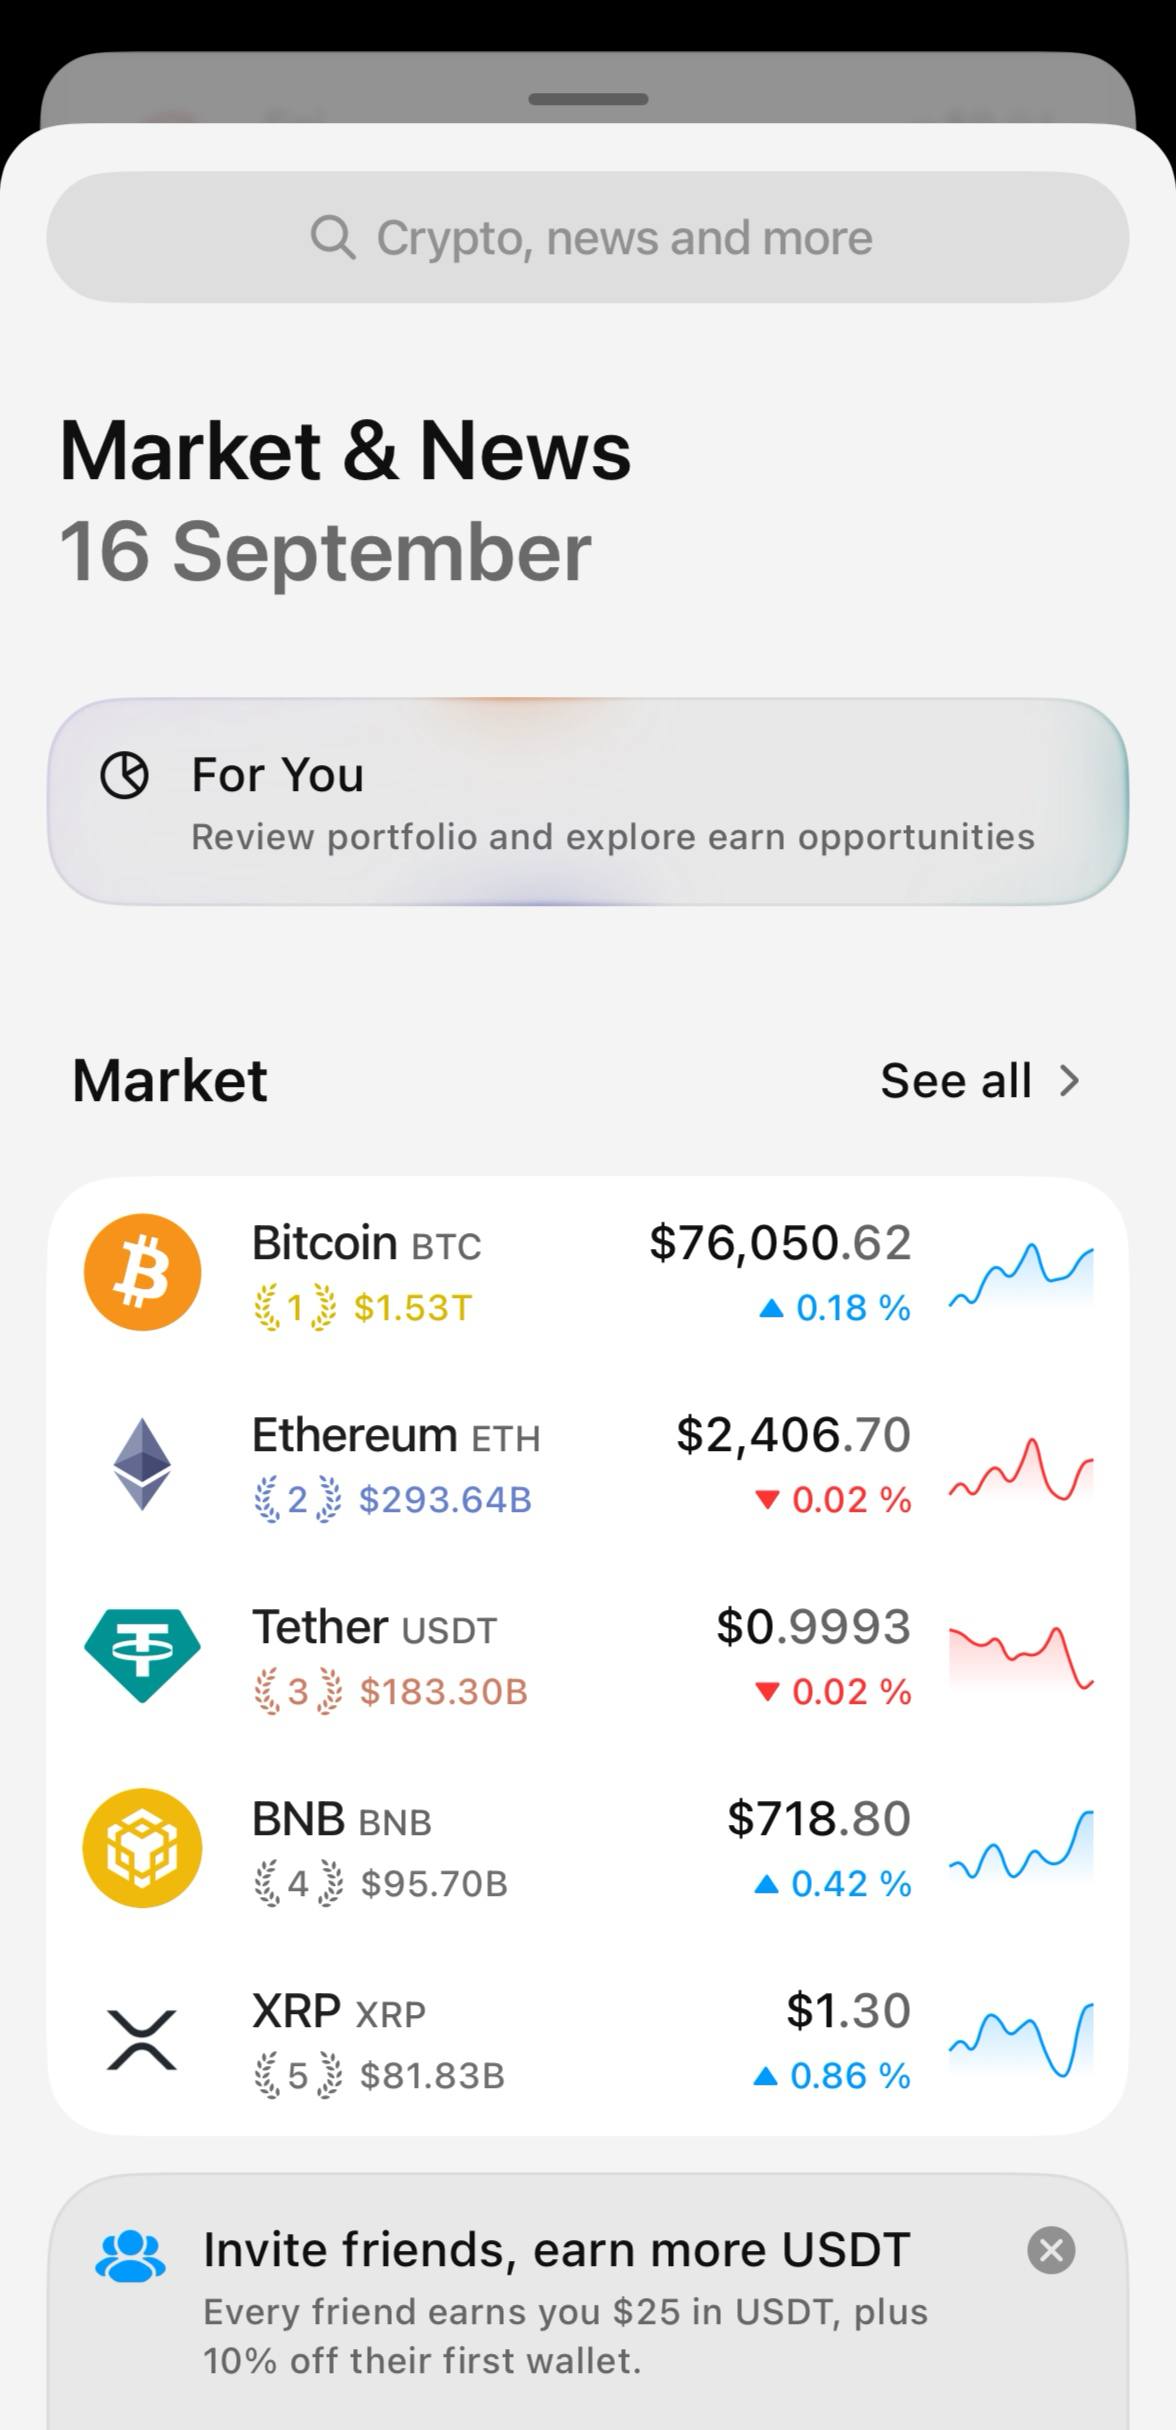
The For You banner appears when you swipe up the Market sheet automatically after updating to Tangem App 6.3.
Check your total portfolio. Open the app. Your aggregated portfolio value is at the top of the For You section. Tap into it to see the full breakdown by asset and the composition chart. Filter by wallet to get a specific view.
Review indicators before making a decision. Tap any token to see its market indicator panel. Check the daily, weekly, and monthly views. Use it as one input alongside your own research.
What 'For You' is not
For You is an information tool. It shows you what you own, what the market data says, and what opportunities exist at current rates.
It is not a portfolio performance tracker.
It is not an advisory service. Tangem does not recommend that you buy, sell, hold, or stake any asset. Market data is sourced from third parties and based on publicly available information.